🔺 Reversal Patterns (Trend Change)
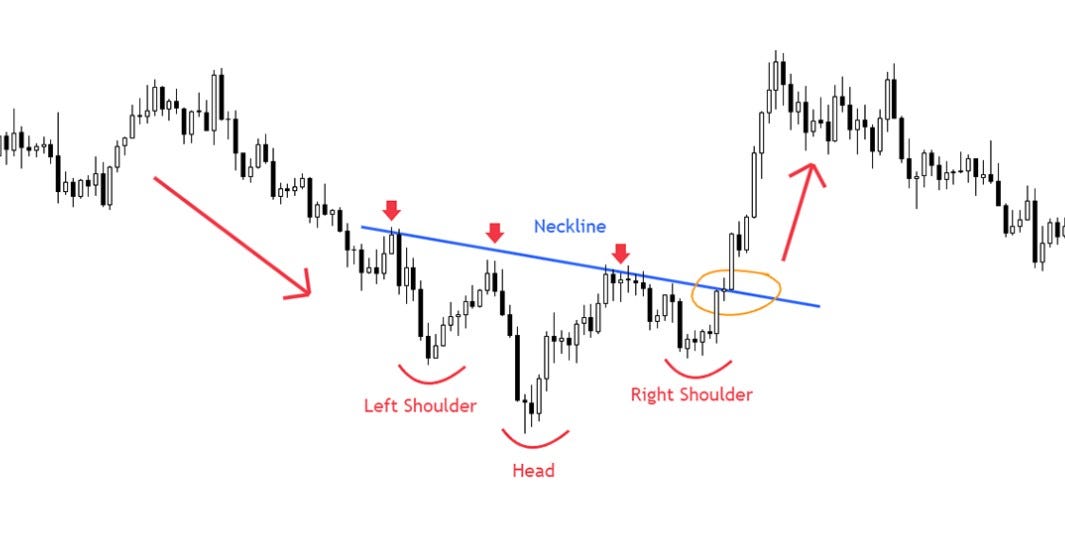
1️⃣ Head and Shoulders – Market is shifting from an uptrend to a downtrend (Bearish).

2️⃣ Inverse Head and Shoulders – Market is shifting from downtrend to an uptrend (Bullish).
3️⃣ Double Top – Price hits the same high twice and then drops (Bearish).

4️⃣ Double Bottom – Price hits the same low twice and then rises (Bullish).
🔄 Continuation Patterns (Trend Continues)
5️⃣ Triangles (Ascending, Descending, Symmetrical) –
Price is consolidating, then breaks out in the same direction.
A. Ascending Triangle (Bullish Signal)
- Formation: A horizontal resistance line at the top and an upward-sloping support line at the bottom.
- Signal: Usually a bullish continuation pattern, indicating an upward breakout.
- Confirmation: Price breaks above resistance with increasing volume.

B. Descending Triangle (Bearish Signal)
- Formation: A horizontal support line at the bottom and a downward-sloping resistance line at the top.
- Signal: Typically a bearish continuation pattern, signaling a downward breakout.
- Confirmation: Price breaks below support with a surge in volume.

c. Symmetrical Triangle (Neutral/Bilateral Signal)
- Formation: Two converging trend lines without a clear horizontal resistance or support.
- Signal: The breakout direction is uncertain – it can go either up or down.
- Confirmation: Traders wait for a confirmed breakout with strong volume before making a move.

6️⃣ Flags – A short pause before the trend continues (Bullish or Bearish).

7️⃣ Wedges (Rising & Falling) – A wedge pattern looks like a flag but with lines that get closer together. It often comes with lower trading volume as it forms.
-
Rising Wedge (Bearish)
- Price moves upward but squeezes into a smaller range.
- A downward breakout signals a drop—good for shorting or exiting long trades.
-
Falling Wedge (Bullish)
- Price moves downward but narrows.
- An upward breakout signals a rise—good for buying or exiting short trades.

💥 Breakout & Indecision Patterns
8️⃣ Cup and Handle – A U-shaped price movement followed by a small dip before breaking out (Bullish).

9️⃣ Rounding Top & Bottom – A Rounded Top looks like an upside-down “U” and signals a downtrend. A Rounded Bottom looks like a “U” and signals an uptrend.
Unlike double tops or bottoms, these patterns take longer to form.
- In a Rounded Top, prices rise initially, but as lower highs start forming, it shows sellers are taking control.
- In a Rounded Bottom, prices gradually rise after a slow downtrend, showing buyers are stepping in.

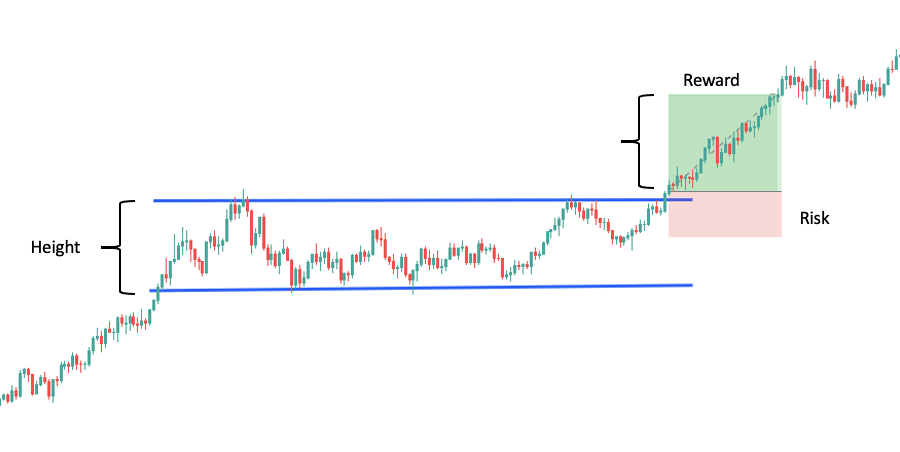
🔟 Rectangles – Price moves within a box before breaking out.
Trading Chart Patterns – Quick Summary
Chart patterns help traders predict price movements. They fall into three main categories:
🔹 Reversal Patterns – Signal a trend change.
🔹 Continuation Patterns – Indicate the trend will continue.
🔹 Neutral Patterns – Could break in either direction.
Key Patterns & How to Trade Them
1️⃣ Reversal Patterns (Trend Change)
📉 Head & Shoulders → Bearish reversal, sell below neckline.
📈 Inverse Head & Shoulders → Bullish reversal, buy above neckline.
📉 Double Top → Bearish reversal, sell after the second peak.
📈 Double Bottom → Bullish reversal, buy after the second low.
2️⃣ Continuation Patterns (Trend Continues)
📈 Bullish Flag → Buy after breakout above resistance.
📉 Bearish Flag → Sell after breakout below support.
📈 Ascending Triangle → Buy when price breaks above resistance.
📉 Descending Triangle → Sell when price breaks below support.
3️⃣ Neutral Patterns (Breakout in Either Direction)
🔄 Symmetrical Triangle → Trade the breakout direction.
🔄 Rectangle Pattern → Buy at upper breakout, sell at lower breakdown.
Trading Strategy for Patterns
✔ Confirm the pattern (wait for breakout or use indicators).
✔ Set a stop loss (below support for bullish, above resistance for bearish).
✔ Choose a profit target (pattern height helps estimate move).
✔ Risk-Reward Ratio (aim for at least 1:2).
By following these steps, traders can use patterns to improve accuracy and manage risk effectively! 📊